04Analysis · MATLAB
ECG RR-interval variability
Two simulated rhythms with nearly the same average heart rate, separated by how much the time between beats varies.
Coursework · Simulated signals, not clinical data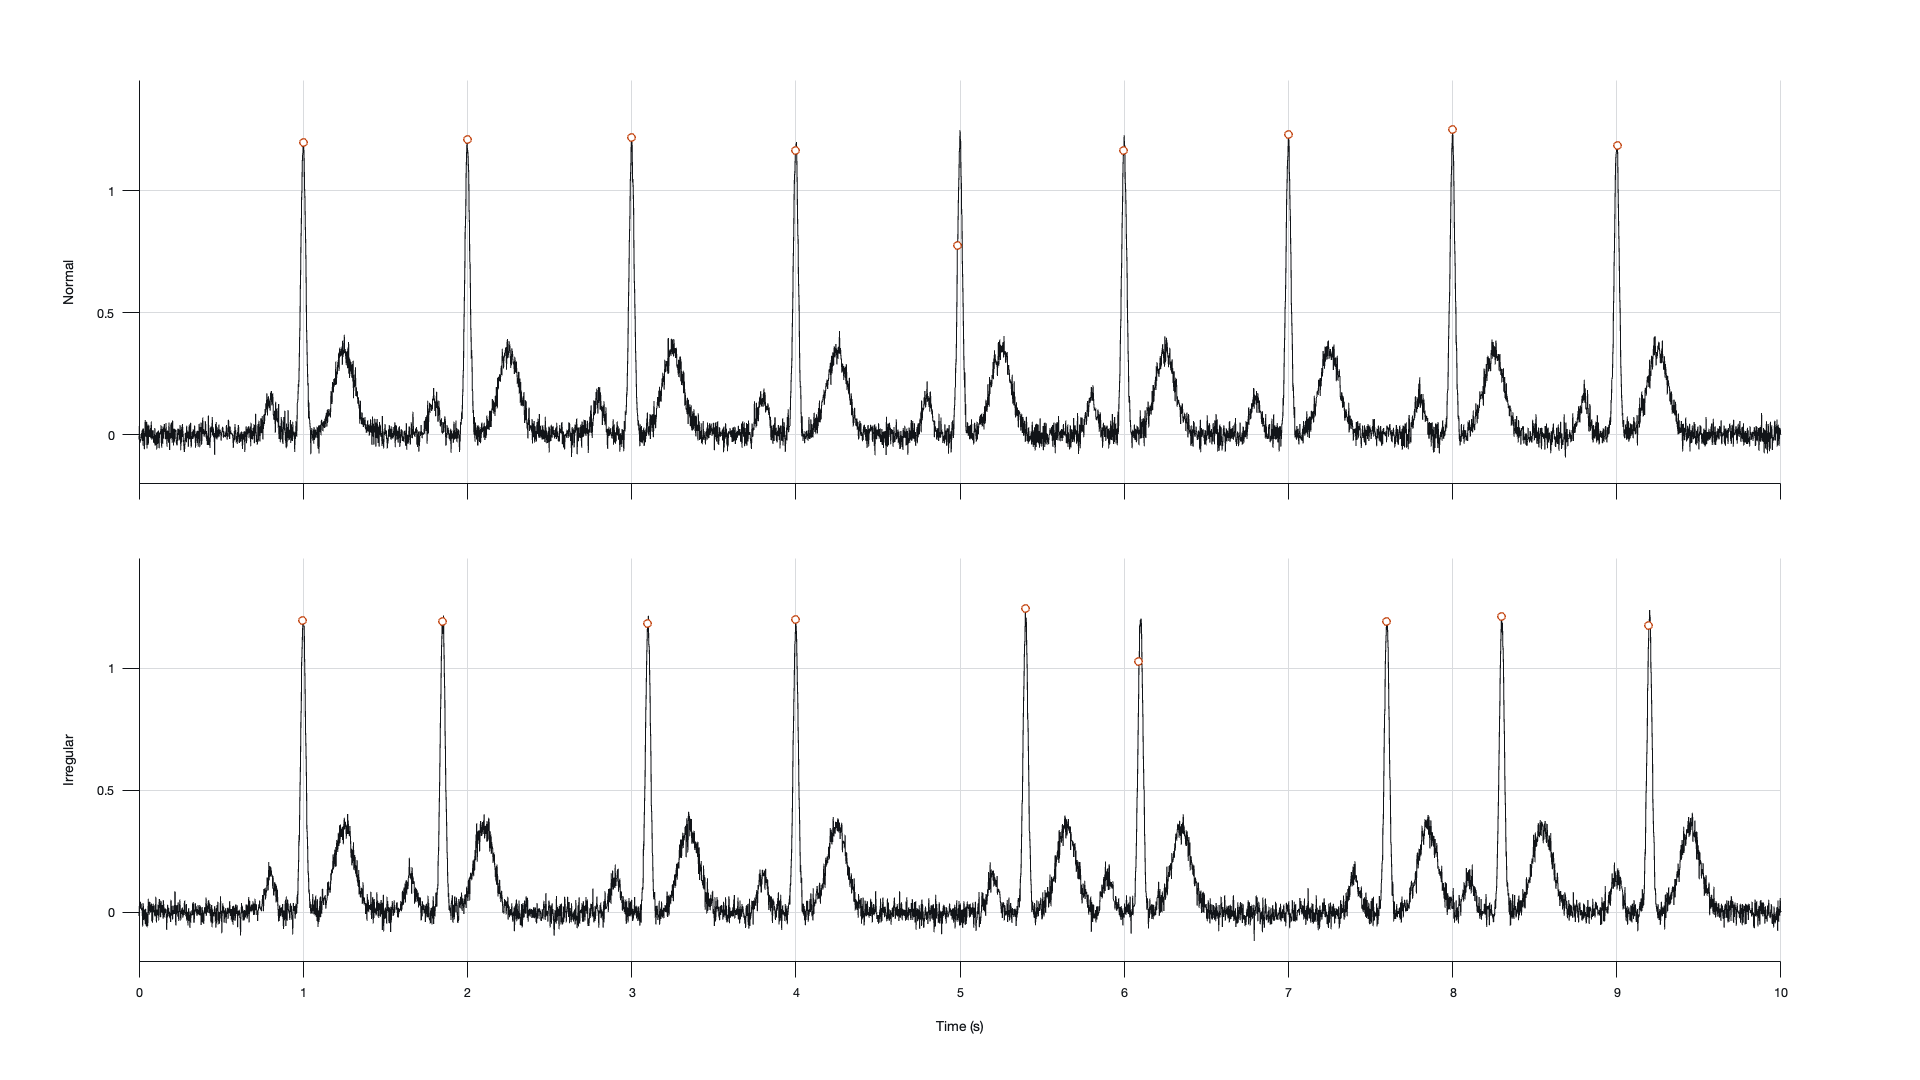
MATLAB output, seed rng(1). Circles mark detected R peaks; two sit on the rising edge, discussed under Outcome and limits.
- Course
- BME 240, Modeling Physiological Data and Systems, University of Illinois Chicago
- Term
- Spring 2026
- Team
- 2 students, submitted as a pair
- My part
- All of the work: signal model, detector, analysis and paper
01Problem
Irregular heart rhythms show up as uneven spacing between beats. I tested whether one simple timing measure, the spread of RR intervals, can separate a regular rhythm from an irregular one.
02Requirements and constraints
- Controlled signals: 10 s at 500 Hz, with the same waveform shape, so beat timing is the only variable.
- The same detector on both signals.
- Reproducible numbers: a fixed random seed.
03Design decisions and why
- 01Synthetic beats from Gaussians.
- Each beat sums a small P wave, a tall narrow R peak and a wider T wave, a shape used in published synthetic-ECG models. Normal beats fall every second from 1 to 9 s. Irregular beats fall at uneven times over the same window. Added noise (σ = 0.03) keeps the signal from being perfectly clean.
- 02A detector with a refractory window.
- A sample counts as an R peak if it is above 0.6, higher than both neighbors, and at least 0.4 s after the last peak. The threshold ignores P and T waves. The 0.4 s window ignores noise around a peak and caps detection at 150 beats per minute.
- 03Coefficient of variation as the main metric.
- CV = σRR ÷ μRR scales the spread by the average spacing, so it compares rhythms at different rates.
04What I did
I wrote the MATLAB signal model, the R-peak detector and the RR, SD and CV analysis, plotted the results, and wrote an IEEE-format paper with the full code in an appendix. The October 2026 revision re-runs the same code with a fixed seed and marks the detected peaks on the plots.
05Outcome and limits
| Signal | Mean RR (s) | SD (s) | CV |
|---|---|---|---|
| Normal | 1.000 | 0.007 | 0.007 |
| Irregular | 1.025 | 0.317 | 0.309 |
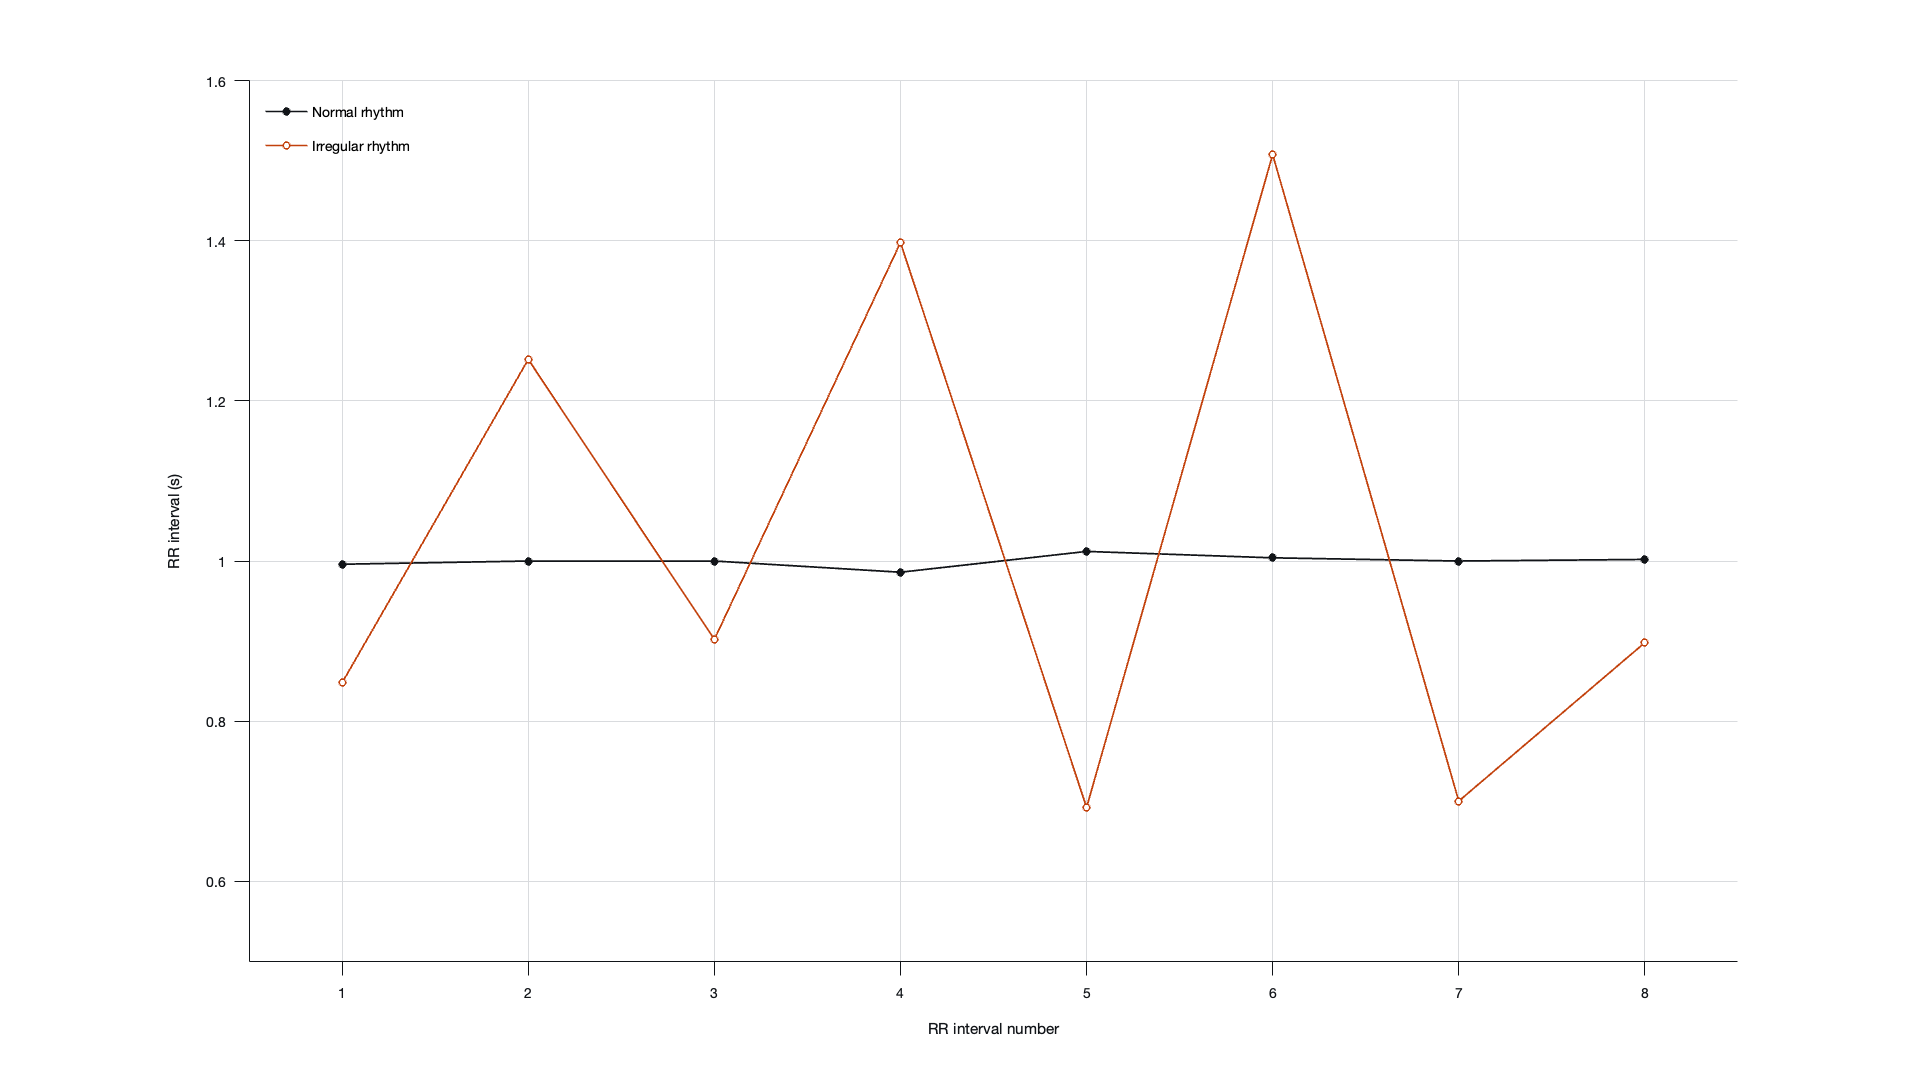
The mean RR intervals were nearly equal, but the irregular rhythm’s coefficient of variation was more than 40 times the normal one. Marking the detections exposed a detector flaw: twice, noise on the rising edge of an R wave formed a local maximum above the threshold, so the detector fired about 8–14 ms early and its 0.4 s window skipped the true peak. That error accounts for most of the normal rhythm’s 0.007 s spread. The signals are synthetic, a fixed threshold fails when amplitude changes, and irregular timing is not a diagnosis.
06What I’d do next
- Fix the detector by taking the largest sample within a short window after each threshold crossing.
- Run the pipeline on real recordings, such as the MIT-BIH Arrhythmia Database on PhysioNet.
- Replace the fixed threshold with an adaptive detector, for example Pan–Tompkins.
Sources
Show all 4 sources
- Task Force of the ESC and NASPE. Heart rate variability: standards of measurement, physiological interpretation, and clinical use. Circulation 93(5), 1043–1065 (1996).
- Sayadi O, Shamsollahi MB. Synthetic ECG generation and Bayesian filtering using a Gaussian wave-based dynamical model. Physiol Meas 31(10), 1335–1350 (2010).
- Moody GB, Mark RG. The impact of the MIT-BIH Arrhythmia Database. IEEE Eng Med Biol Mag 20(3), 45–50 (2001). physionet.org
- Pan J, Tompkins WJ. A real-time QRS detection algorithm. IEEE Trans Biomed Eng BME-32(3), 230–236 (1985).